Table 1. Cytokine levels in patients in treatment for stage II EH who developed cardiovascular complications during the 5-year follow-up period and those who did not
have any complications. М (σ)
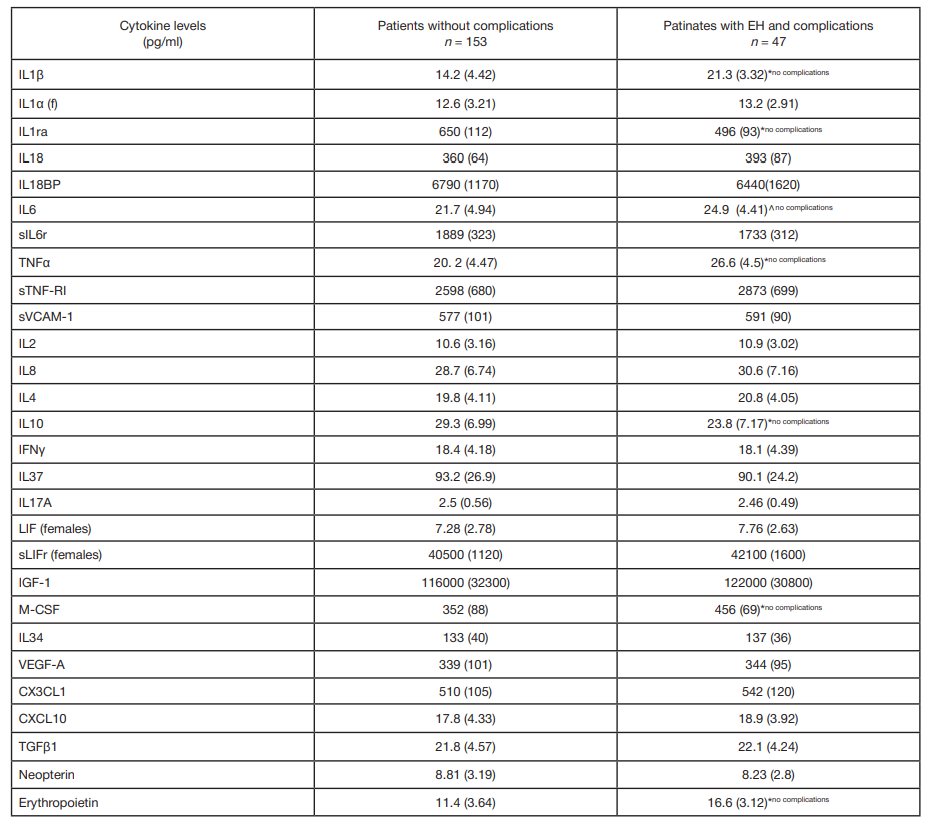
Note: ^ — p < 0.01; * — p < 0.001 in comparison with patients without complications reported in the 5-year follow-up period.
Table 2. The relationship between changes in IL1ra, IL1β, IL6, TNFα, M-CSF, and IL10 concentrations measured at the beginning of the study AND the rate of
complications (95% CI) during the 5-year follow-up period in patients in treatment for long-settled EH
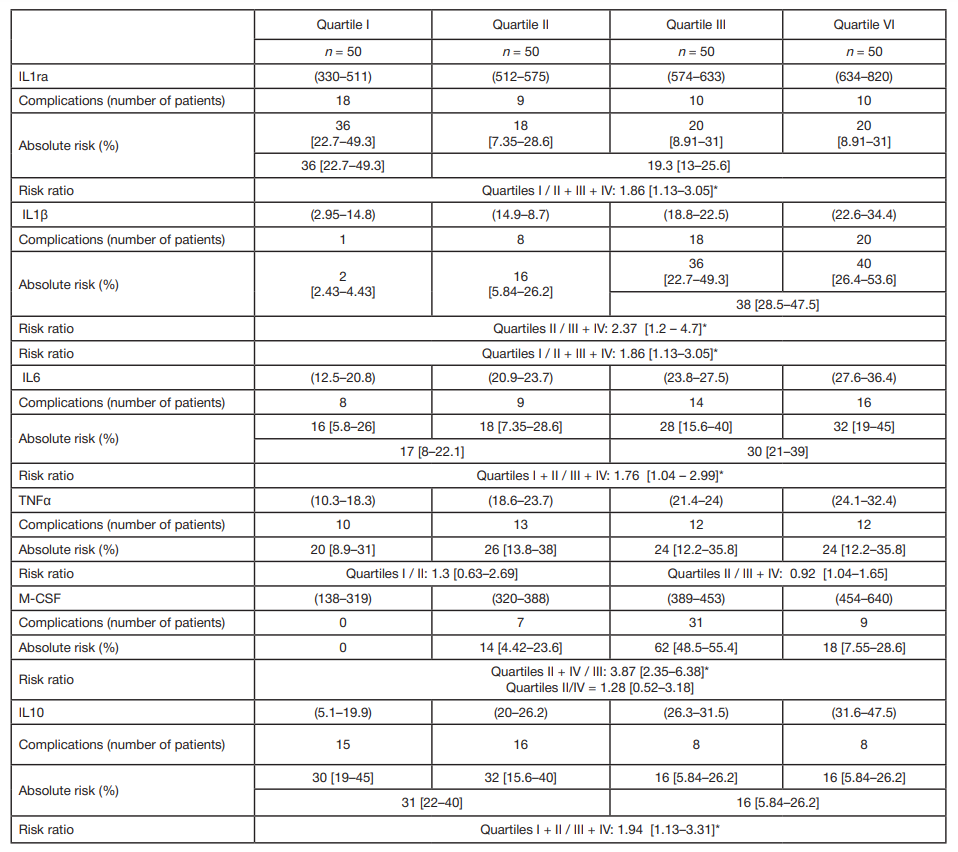
Note: * — р < 0.05 for the comparison of absolute risks if the interval does not include 1.
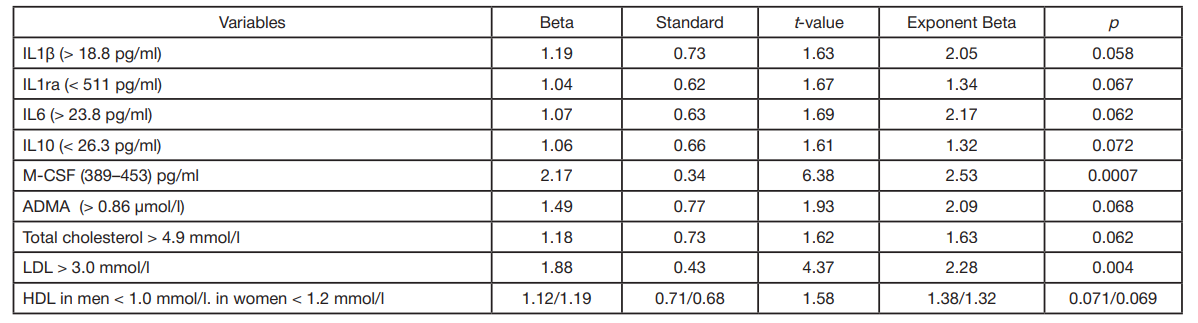
Table 3. Correlations between IL1β, IL1ra, IL6, IL10, and M-CSF concentrations AND the rate of cardiovascular complications (95% CI) during the 5-year observation
period in patients with stage II EH. The univariate Cox regression
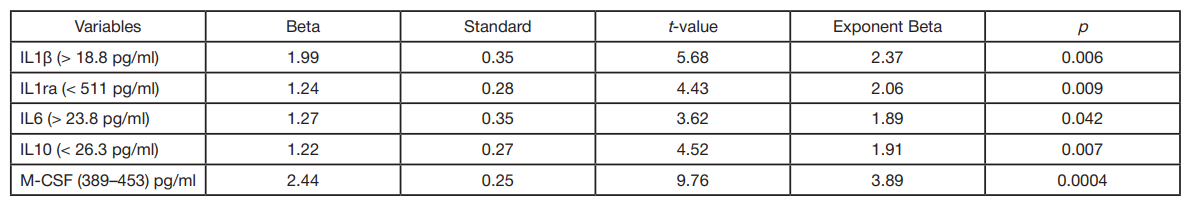
Note: in our Cox regression models, Beta is a regression coefficient; Standard is a standard error of the regression coefficient; t-value is the t-statistic; Exponent Beta is the value of the relative risk indicating a connection with the range of changes in the analyzed factor; p shows statistical significance.
Table 4. A correlation matrix for the cytokines in the peripheral blood of patients in treatment for stage II EH and the vasoactive peptides measured in the same patients
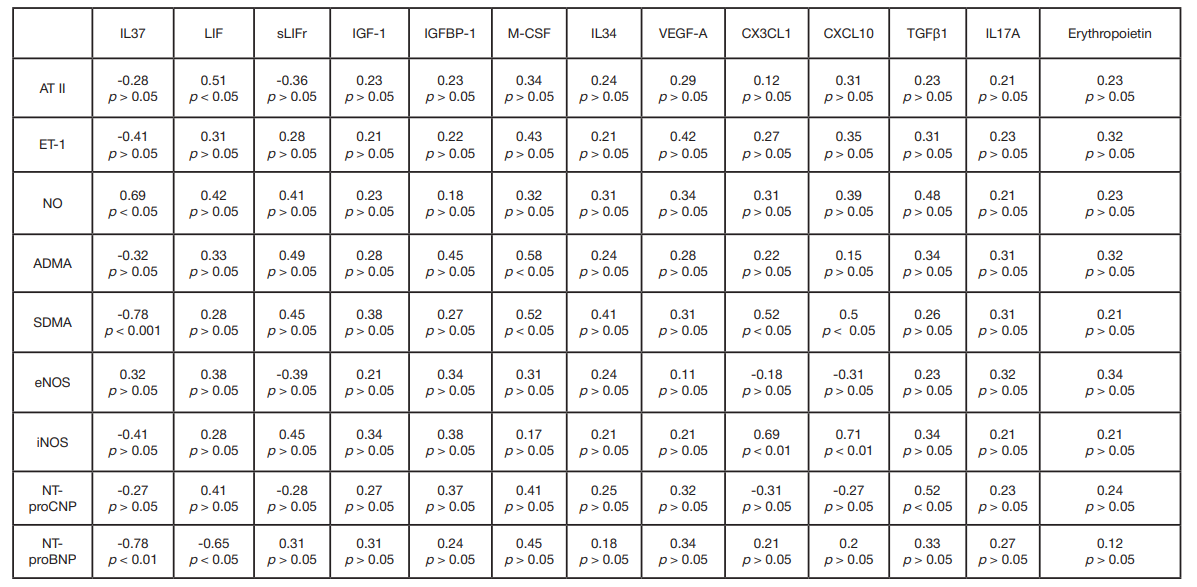
Note: the data are presented as a coefficient of multiple correlation; the minus symbol indicates that the established correlation is negative; р shows the significance of differences.
Table 5. A correlation matrix for the cytokines in the peripheral blood of patients in treatment for stage II EH and the vasoactive peptides measured in the same patients
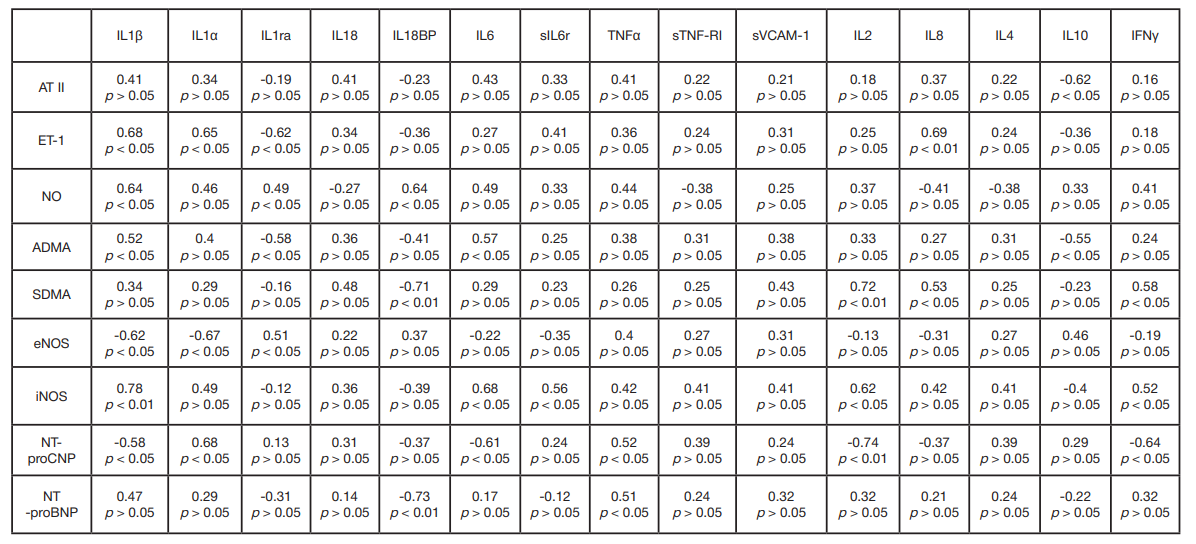
Note: the data are presented as a coefficient of multiple correlation; the minus symbol indicates that the established correlation is negative; р shows the significance of differences.
Table 6. Correlations between IL1β, IL1ra, IL6, IL10, M-CSF, ADMA concentrations and classic risk factors AND the rate of cardiovascular complications (95% CI) in a
5-year observation period in patients with stage II EH; the table shows the Cox regression model; the multivariate analysis was applied
Note: in our Cox regression models, Beta is a regression coefficient; Standard is a standard error of the regression coefficient; t-value is the t-statistic; Exponent Beta is the value of the relative risk indicating a connection with the range of changes in the analyzed factor; p shows statistical significance.
