ORIGINAL RESEARCH

Associations between SNPs in the genes encoding urokinase system proteins and the risk of placental insufficiency

Revina DB1, Balatskiy AV1,2, Larina EB3, Oleynikova NA1, Mishurovsky GA1, Malkov PG1, Samokhodskaya LM1, Panina OB1, Tkachuk VA1,2
About authors

1 Lomonosov Moscow State University, Moscow, Russia

2 National Medical Research Center for Cardiology, Moscow, Russia

3 Lapino Clinical Hospital "Mother and Child", Moscow, Russia

Correspondence should be addressed: Daria B. Revina
Lomonosovsky prospect, 27, k.1, Moscow, 119192; moc.liamg@airad.ayaksnizol

About paper

Funding: this study was conducted under the state assignment for Lomonosov Moscow State University using the equipment acquired as part of the Scientific Development Program of Lomonosov Moscow State University.

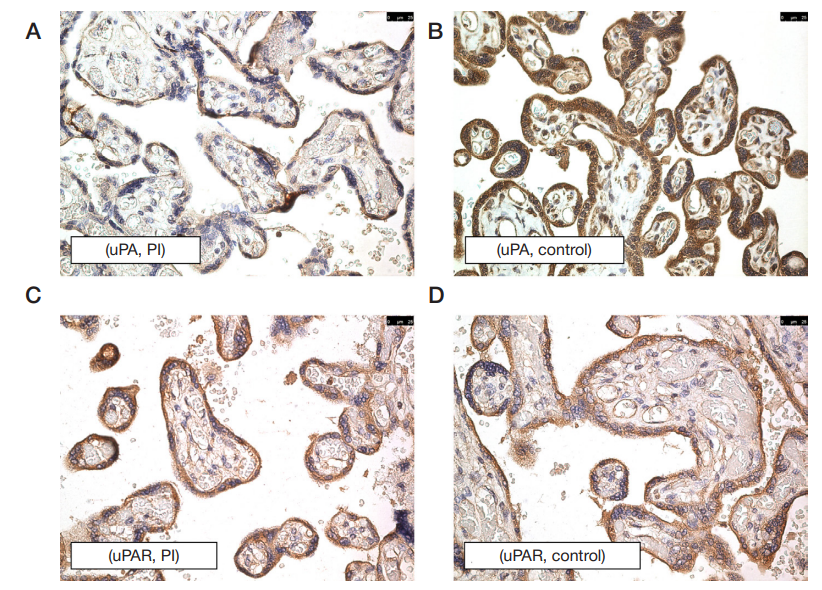
Acknowledgement: the authors thank Mamedov NN, PhD Med, an Assistant Professor at the Department of Obstetrics and Gynecology (Faculty of Fundamental Medicine, Lomonosov Moscow State University) for his help in creating the collection of biosamples (umbilical cord fragments, blood samples).

Author contribution: Revina DB, Balatskiy AV, Larina EB, Samokhodskaya LM, Panina OB, Tkachuk VA — study design; Revina DB, Balatskiy AV, Larina EB, Oleynikova NA, Mishurovsky GA — collection and processing of biosamples and clinical datal; Revina DB, Balatskiy AV, Mishurovsky GA — statistical analysis; Revina DB, Balatskiy AV — interpretation of the results; Revina DB, Balatskiy AV, Oleynikova NA, Mishurovsky GA — manuscript preparation; Malkov PG, Samokhodskaya LM, Panina OB, Tkachuk VA — manuscript revision; Revina DB and Balatskiy AV equally contributed to the study.

Received: 2019-10-31 Accepted: 2019-11-18 Published online: 2019-12-07
|
Fig. 1. Immunohistochemical expression of uPA (A, B) and uPAR (C, D) in the chorionic villi in the controls (A, C) and the PI group (B, D). Staining of syncytiotrophoblast cells with anti- uPA and anti- uPAR antibodies produces intense coloration in healthy tissue and samples of PI patients (A–D). Placental tissue of patients with PI (A) shows less intense coloration of ssyncytiotrophoblast cells after uPA staining in comparison with the control group (B). No difference was observed in immunohistochemical uPAR expression between the groups (C, D). Scale bar: 25 µm
Fig. 2. The vessel surface area and the stroma-to-vessel ratio for different maternal PLAU rs4065 genotypes. The ends of the box are Q1 and Q3; the vertical line inside the box is the median. The ends of the whiskers: Q1 minus 1.5 IQR; Q3 plus 1.5 IQR. Outliers are represented by dots. Confidence intervals are represented by notches
Table 1. Genotype frequencies for urokinase system SNPs associated with the risk of PI
Note: * — OR (95% CI) adjusted for maternal age.
Table 2. Parameters of the regression model showing the relationship between the risk of PI and SNPs in the genes encoding urokinase system proteins
Table 3. Morphological characteristics and immunohistochemical expression of uPA/uPAR in placental tissue
Table 4. The vessel surface area and the stroma-to-vessel ratio for different maternal PLAU rs4065 genotypes
Note: * * — the Kruskal–Wallis test applied.