ORIGINAL RESEARCH

Fluorescence imaging of actin cytoskeleton changes in cancer cells upon chemotherapy

Klementieva NV1, Furman OE1,2, Mishin AS1,3, Lukyanov KA1,3, Zagaynova EV1
About authors

1 Research Institute of Biomedical Technologies,
Nizhny Novgorod State Medical Academy, Nizhny Novgorod, Russia

2 Lobachevsky State University of Nizhny Novgorod – National Research University, Nizhny Novgorod, Russia

3 Laboratory of Biophotonics, Department of Genetics and Postgenomic Technologies,
M. M. Shemyakin and Yu. A. Ovchinnikov Institute of Bioorganic Chemistry, Russian Academy of Sciences, Moscow, Russia

Correspondence should be addressed: Natalia Klementieva
pl. Minina i Pozharskogo, d. 10/1, Nizhny Novgorod, Russia, 603005; moc.liamg@aveitnemelkvn

About paper

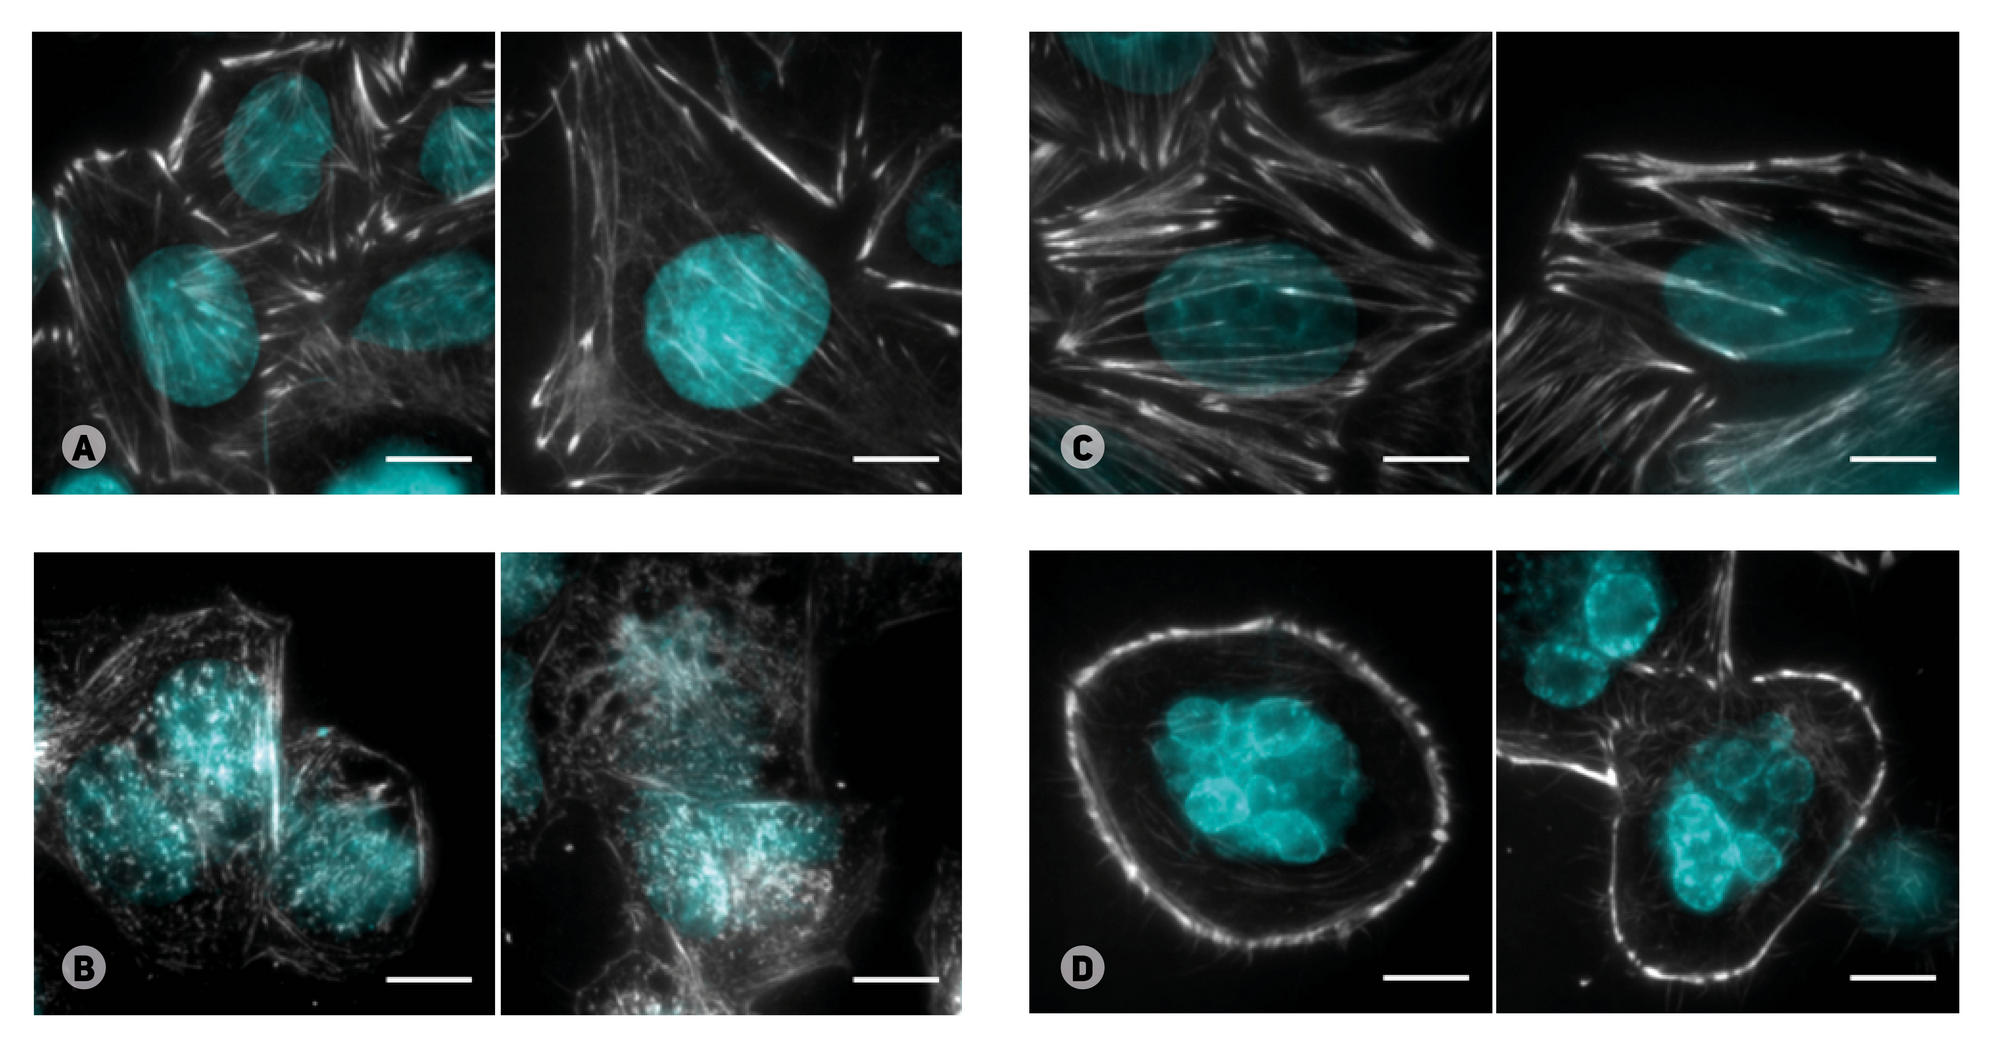
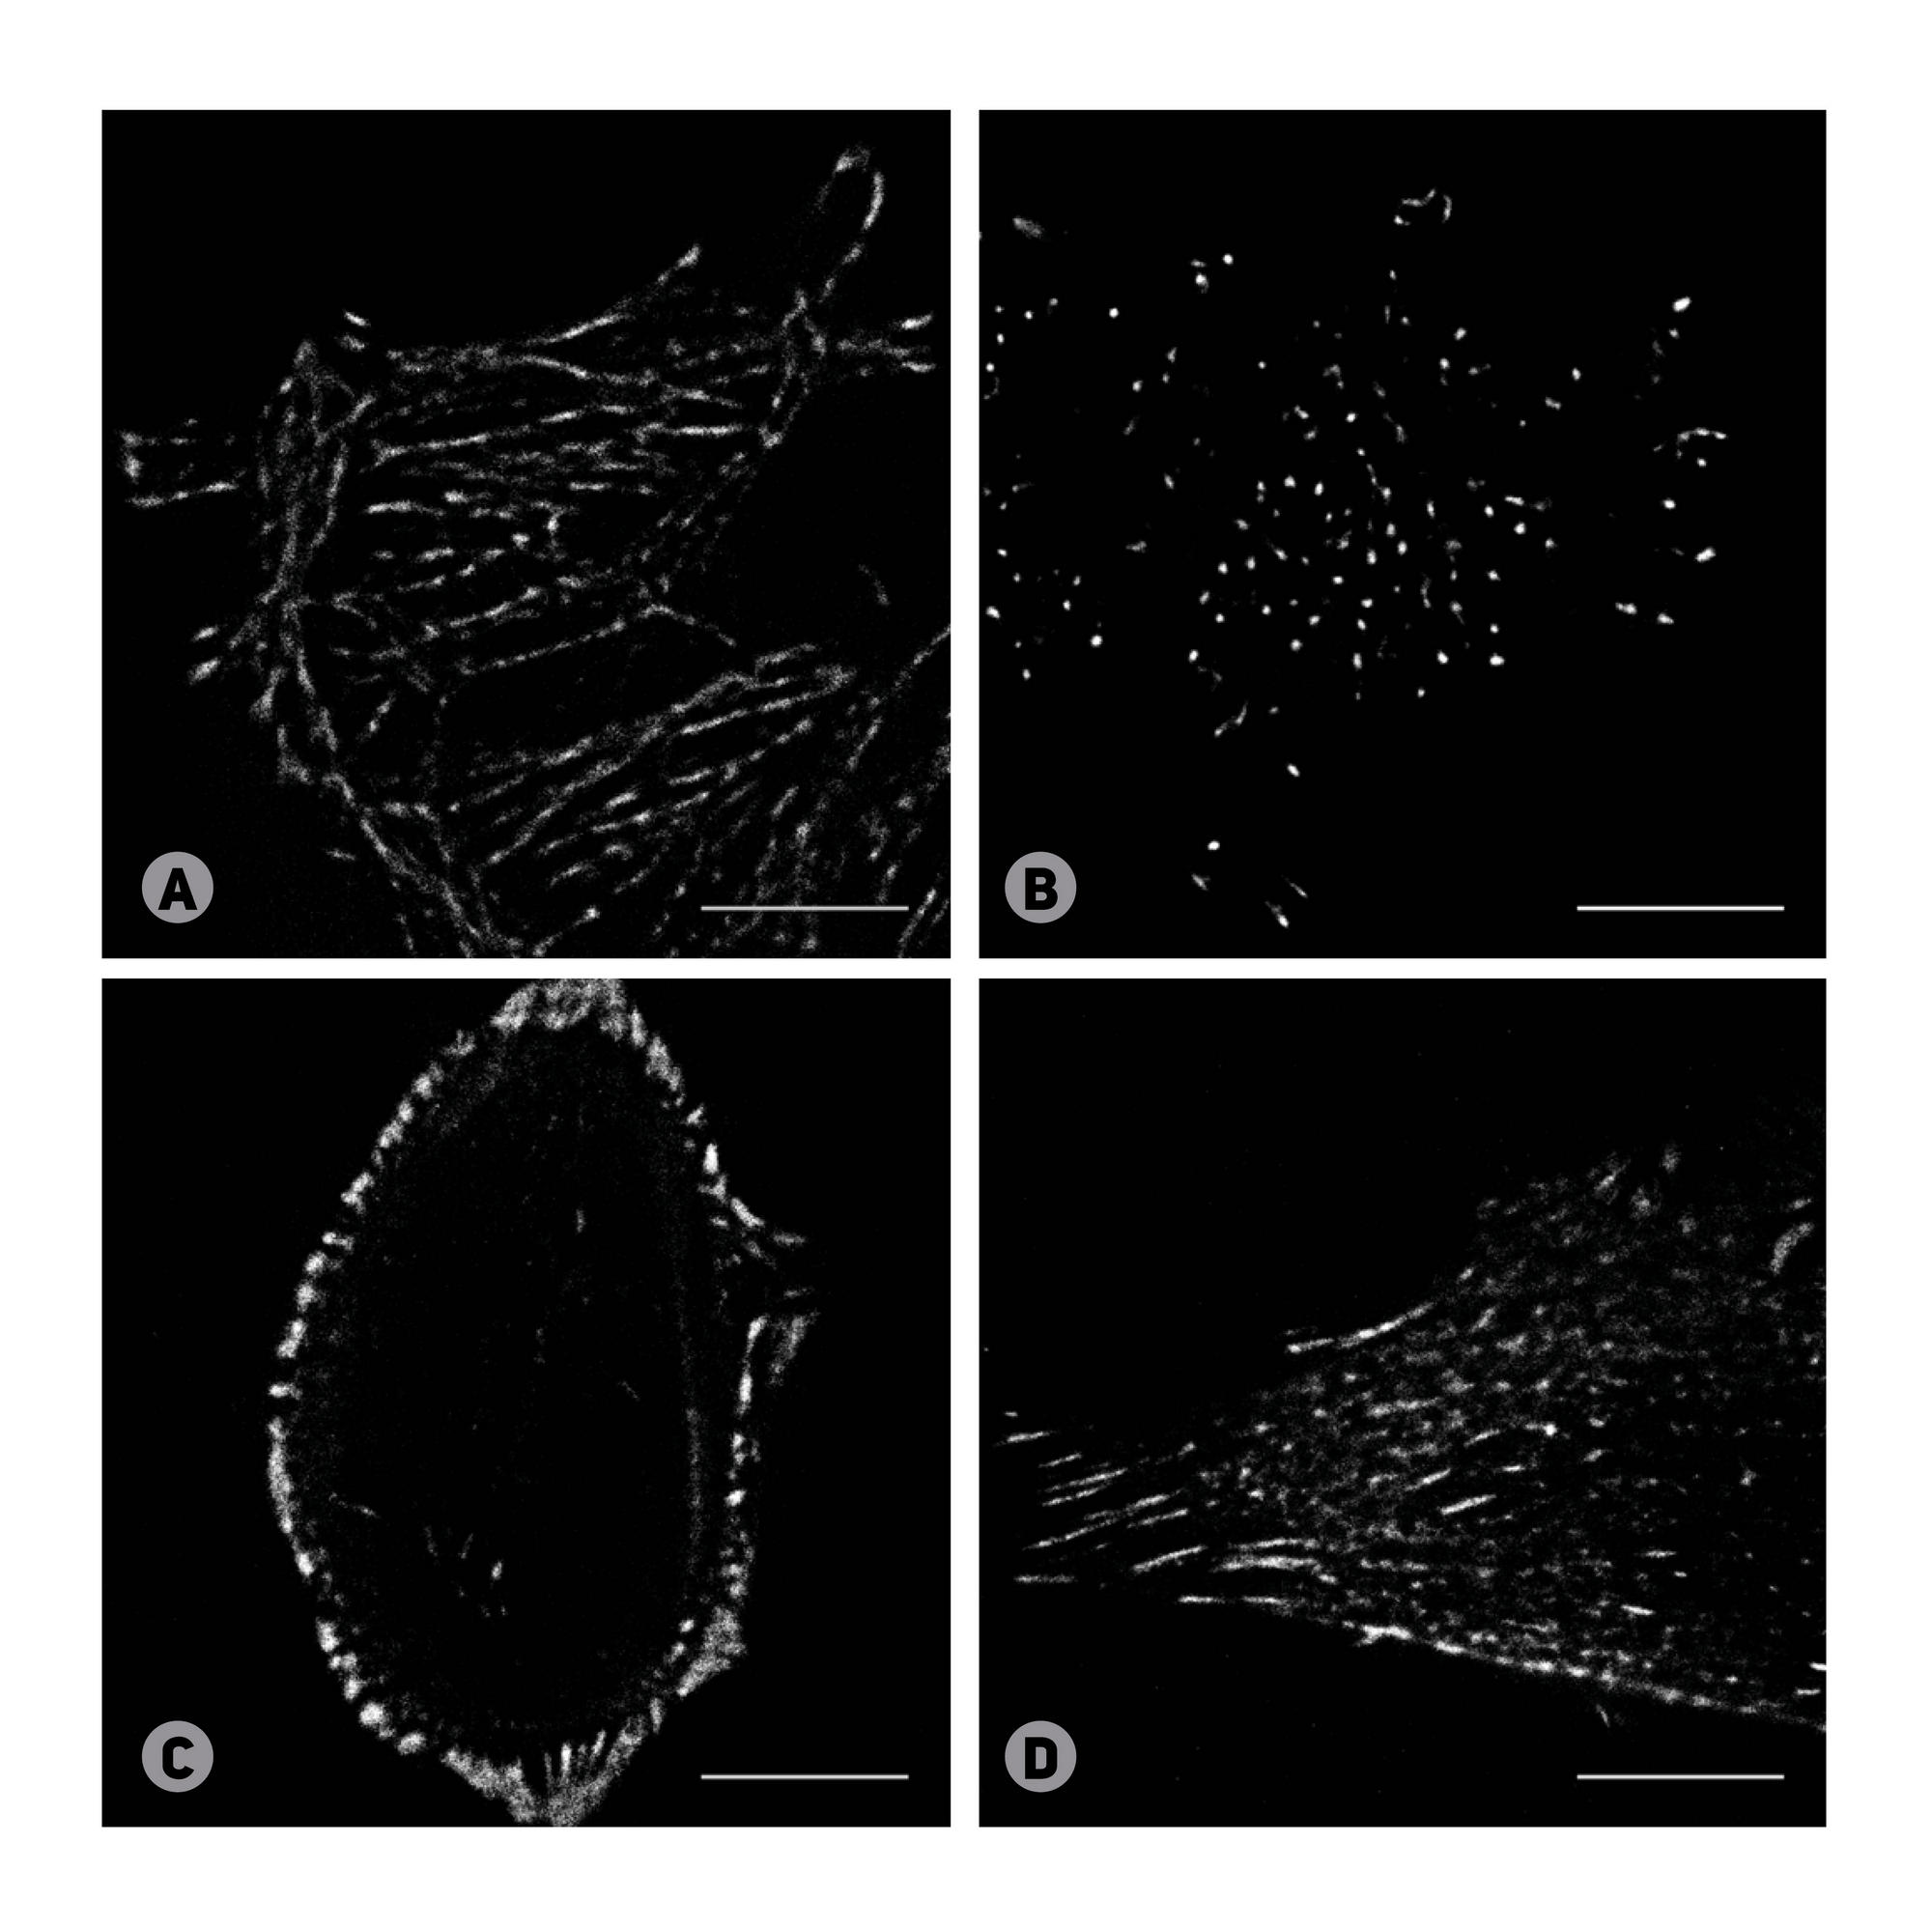
Funding: this work was supported by the Russian Science Foundation (project no. 14-25-00129).

Acknowledgements: authors thank the IBCH Core Facility for the equipment.

Received: 2016-08-15 Accepted: 2016-08-25 Published online: 2017-01-05
|
Fig. 1. Effects of chemotherapy drugs (LC50) on the actin structure in HeLa Kyoto cervical cancer cells. (A) The control sample. (B) Cells incubated with cytochalasin D. (C) Cells incubated with cisplatin. (D) Cells incubated with paclitaxel
Fluorescence TIRF microscopy. Staining with SiR-actin (Spirochrome, Switzerland) and Hoechst 33342 (Thermo Fisher Scientific, USA). The actin cytoskeleton and the nuclei are shown in grey and blue, respectively. The scale bar is 10 μm.
Fig. 2. Super-resolution single-molecule localization fluorescence microscopy of alpha-actinin labeled with fluorescent protein TagRFP in HeLa Kyoto cervical cancer cells. (A) The control sample. (B) Cells incubated with cytochalasin D. (C) Cells incubated with paclitaxel. (D) Cells incubated with cisplatin
The chemotherapy drugs were added at LC50. The scale bar is 10 μm.